 |
TrendSeekers
Home of AIM-ReBal & PPO XOver |
|
| Introducing the AIM RE-Balance method (This Page) | ||
| click here for PPO XOver | ||
Disclaimer:
I make no claims as to the accuracy or viability of the information contained herein. This web site is presented for reference information only and not intended as advice to buy or sell any securities or funds or any financial sorts of things at all, of any kind. Please! Use caution with any investments you make. It is posible to lose money using AIM, AIM-ReBal, PPO XOver or any other investment plan
First let me say that in order to do the AIM-RE-BAL you will need to have a portfolio of 3 to 4 stocks and would probably not want to start with an combined amount of stocks and cash less than $3000 to $5000. If you don't have this much money to invest then you will have a tough time gaining ground. So start saving your money!
Now! On with the show..........
A note about AIM Re-Bal.
I am doing a study to determine how this will do on the DOW 30 stocks. When conducting my first portfolio of the first four stocks (AA AXP BA and C), I discovered to my chagrin that Reg AIM did better than AIM Re-Bal on the same 4 stocks. I can only conclude that using AIM Re-Bal on stogy old Blue Chips or any other low BETA stocks may not work that well, or at least if they are all of that type as in this case.
While more tests have to be done and it's extremely important to know just what works and what doesn't work and especially if your investing real money, my advice is to be very careful which stocks you use at this point. My previous tests were conducted with high BETA stocks and that may be where the real power of AIM Re-Bal is.
Jibes.
I have discovered a fantastic method for buying and selling stocks in a 3 or 4 or even 5 stock Portfolio Combining Robert Lichello's AIM method (by the book) and a simple monthly rebalancing. I believe using this method will garner excellent returns over time that will beat the market and (not in all cases) beat regular AIM while giving the investor "peace of mind." Peace of mind is very important for someone who wants to do better than simple "buy and hold" but does not want to worry if the market takes a downturn, a person who even likes a downturn because it means picking up bargains. As a matter of fact AIM Re-Bal might even be safer than ordinary AIM in some cases since you would be diversified. I am using this method and am using it on 5 portfolios of 4 stocks each. I think 4 stocks in a portfolio would be the best number to use.
What is AIM?
AIM is a method that uses a simple but powerful formula for buying and selling stocks. It is easy to use and there are several sites devoted to the use of aim. The basic premise of aim is half your money is in stocks and the other half is in cash. As prices rise and fall the formula will tell you how much to buy or sell. The formula is typically checked once a month and the formula also adjusts itself so as to make the portfolio grow over time.
Aim by itself works quite well but it does have some shortcomings. Some of you who have experimented or used AIM will surely know. One of these is running out of cash. If you run out of cash on a decline and if that decline is not over and indeed, may not be over for quite some time in the future there is nothing you can do but sit on the stocks! It could turn out to be a disaster. What if you had picked ENE (Enron) for example. Picking good stocks is still very important
If you choose wildly volatile stocks you could easily run out of cash. Or you could sell most of your stocks too early and miss a big run-up in price.
Don't know AIM?
If you do not know how to do AIM go to this site http://www.jjjinvesting.com/chap2.htm and learn how.
Then come back and learn how to join these two systems for great profits.
Another great link to info on AIM. Or should I say the main link to AIM is here: www.aim-users.com
Also Tom has a great Discussion Board at: A.I.M. Users Bullitin Board.
And for those interested: AIM RE-bal Discussion Board
What is Re-Bal?
Re-Bal is short for Re-Balance. Lets say you have four stocks in your portfolio. Once a month or which ever reasonable time period you choose you would total up the value of those stocks. If you add the values of the stocks in your portfolio (lets say we have 4) you will come up with a total. In this case since we have 4 stocks you would divide the total by 4 and each stock will be compared with that ideal value. Some stocks will be higher and some lower. To rebalance the port you would sell any stock in the higher than the ideal amount and bring them down to that ideal amount and buy enough stock to bring the lower than ideal stocks up to the ideal value. It's as simple as that. Of course one would only buy or sell those stocks that are over or under by a reasonable amount to offset commission costs.
I have read on a web site talking about Re-balancing that Re-Balancing by itself increases portfolio value slightly in the lo
ng run. We want more than that though and that is why we add AIM to the mix.
Why Putting AIM and RE-BAL together works so well?
I don't know but it sure does!
Go here and learn to put the two together:AIM RE-BAL school
|
Question:What is the biggest problem when using AIM or AIM Re-Bal?
Such a small difference can make such a big difference in the bottom line! |
|
Running out of cash is a major problem. |
||||||||||||
Now that I have a new spreadsheet aim-rb-temp.xls I'm able to back-test the effect of the ratio and have found the 50/50 of R. Lichello the best. The author knew what he talking about. But of course whichever ratio you use is up to you but just be sure to watch your cash! Note: I have not fully tested the above spreadsheet. I only offer it in an experimential form. Use at your own risk. |
||||||||||||||
|
|
|||||
| Go to Examples page to see current updated examples | |||||
| New! DOW JONES INDUSTRIALS AIM ReBal | |||||

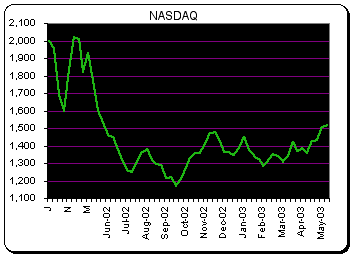
The Nasdaq for the same period
Right now 24 stocks make up the indicator and more might be added. The indicator is made up of just two component indicators. The "Slow Stochastic" and 30 day "Stochastic RSI" which is an indicator based on the "Relative Strength Indicator" (RSI).
The red line is the composite Slow Stochastic.
The yellow is the composite Stochastic RSI.
The Blue line is the "High Blue" - "Low blue" of the Stochastic RSI and it's scale is on the right of the chart and is above or below zero.
Time will tell if this indicator will become useful. I belive it will. when the red "STO TOT" as well as the Yellow "StoRSI" is above 70 then stocks are "ripe" for plucking. Conversly when they are below 30.... especially good for buying.
7-6-2002
This week being a shorter than usual week saw a rally on wed and friday. Earlier in the week it looked as though the indicators were going to dive to the bottom but 'twas not the case. I think that since the indicators went up from the previous week and the nasdaq is lower this is a good sign of a potential bottom for at least the short term. Also the fact that the STO TOT and StoRSI are not near as low as sept/oct but the nasdaq is lower is another very good sign from a technical stand point.
Of course these indicators are too new to "bet the farm" on but at least we know that bear trends end at some point and are usually quicker than uptrends.
I'm now using 24 stock as a basis for these indicators. I don't know if that's enough or not. Last week I had 12. Not all the data is made up of 24 stocks either. The monthly data is only 16 up to april. And, these charts are going to look wierd because the new updates will be weekly and most of the older data is monthly and after just 12 weeks the dew data will be as long as the old. One must bear that in mind.
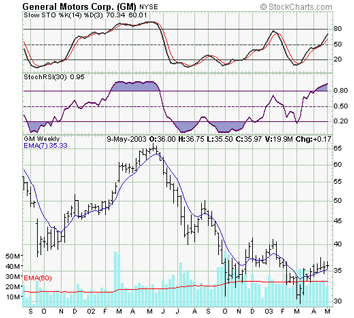
Shown to the left is a typical chart (GM) from stockcharts.com showing the data I use.
The "Slow Stochastic" (top indicator) shows buy and sell areas as below 20 (buy) and above 80 sell.
The "Stoch RSI" is the next indicator and clearly shows the "High blue" and "Low Blue" areas. As long as the stock is in low blue the issue is very bearish. When high blue, Bullish! Also both indicators show good trends.
Slow Stochastic = default settings
Stoch RSI = change to 30 days
Chart from stockcharts.com
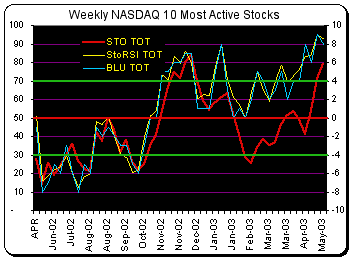
Here is the same data as above only done on the current top 10 most active stocks on friday each week.; The data here is approx 4 months worth of data for the 10 most active of friday june 28th. So take the data with a grain of salt. As time goes by, each week will have data from different stocks (current most active) though the top 10 may mostly be the same 10 stocks from week to week as that has been the case.
6-28-02:
CSCO, SUNW, INTC, ORCL, MSFT,
AMAT, ERICY, CNXT, DELL, NVDA.
7-5-02
CSCO, SUNW, INTC, ORCL, MSFT,
AMAT, DELL, FLEX, JDAS, JDSU.
This Page and this concept was launched
May. 26th, in the year of our Lord... 2002
![]()
Last update ---7/06/2002