 |
||||||
| Dynamic Dollar |
||||||
| Cost Averaging | ||||||
Dynamic Dollar Cost averaging or good old "DDCA" A new AIM like trading program that promises to be a useful tool.
Right now I still have to define how much money to invest at any given signal. By using the Spreadsheet below you can get a pretty good idea of just how much should be traded in general. I am in the process of refining that aspect.
|
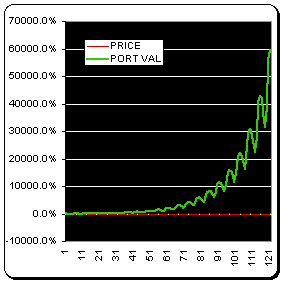
Take for instance this chart: It shows the "Lichello series" for the usual 10 years. As you can see the port Value is up 60,000%! That's $5,950,329 in 10 years. "Big deal!" You say, "The Lichello series is not a realistic measure of a typical stock!" That is true but I just wanted to show how it compared to regular AIM over the same period. If I remember AIM by the book produced just over $1,000,000 with this test and that was good too. |
 |
|
How "DDCA" works. DDCA uses a percentage of PORTFOLIO TOTAL to do it's buying and selling. So it follows the Portfolio Total up and down and buys and sells accordingly. Basically then: Each week or month or set period of time you will find the percentage the stock price either went up or down from the previous Buy or Sell stock price. Then you will take that percentage number and take a percentage of that (percentage of percentage) or as I call it: "Factor". For example, in the chart above I used 90% to sell and 130% to buy. When the result is found you multiply that times the PORTFOLIO TOTAL and that then is the amount to buy or sell. Simple! So if it went down 10% you would multiply that times 1.30 and get 13%. Thus buy 13% of PORTFOLIO TOTAL and so on. The multipliers used for the above test (see chart) does not equate well with real life however. The factor runs more like between 50% and 100% and most likely different for a buy or sell. You could feel this out by logic. For example: If the stock has dropped dramatically over a month or two and you have lots of cash, then consider that your buying Factor could be rased a bit and visa versa. Usually you would want to do more selling if a stock is in a long term bear mode and more buying if long term bullish. So: (Price change percentage from previous Buy or Sell) x (Factor) x (PORTFOLIO TOTAL) = amount B/S Can it get simpler than that???? If done on a weekly (and even monthly) basis you should have a minimum movement requirement set so as not to act on trivial movements. I have found that some stocks do well on a 4 to 7% min. move weekly. Tests could be run on a spread sheet to get good values for these. Reg AIM might work better on low beta stocks. I have not tested this theory yet but I believe stocks that are active would work best. I have done some tests (not enough) and I like what I see so far! Feel free to test this out for yourself and try to prove me wrong. A Spread Sheet. is now available. Its an excel 98 version. I have a Mac but it should work on Intel machines too. When using the spreadsheet the percentage change is now taken from the previous buy or sell. Thanks to lostcowboy for moving the "Min/Max" section to the top, its now much easier to update. Also LC and I both had the same idea of how to keep the last transaction as the basis for a new buy and sell. |
||
The power of DDCA |
||
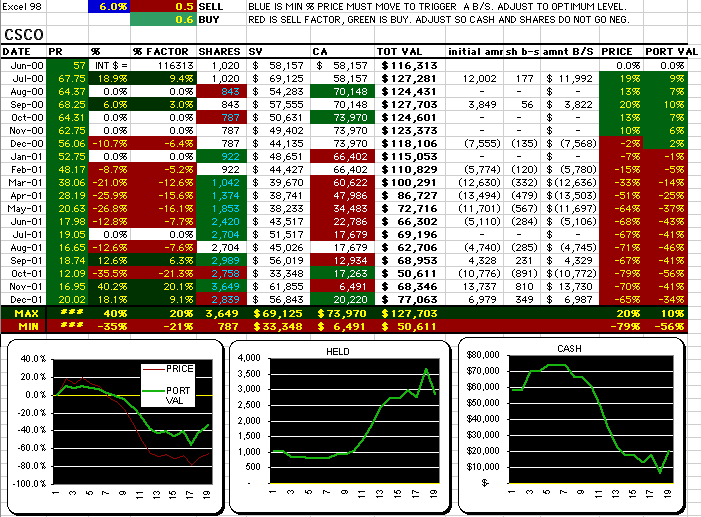
| Below is an example of the cash preserving power of DDCA. As you can see CSCO took a huge fall from $57 to an Oct. 2001 low of $12.09 on this chart. I just wanted to show and compare the performance of DDCA with reg AIM. Not really reg aim either because this example compares the same monthly data set that J.J.J.Investing did on his great book (The end of chapter 2A: Mechanics of Buying and Selling-Part II Bear Market) showing how to preserve cash in a bear market. In that example he recommended increasing SAFE to a higher percentage to conserve cash. In reality his example shows how he had to add funds from the outside world to keep the buying of shares going in spite of the increased SAFE. He started with $116,313 and ended up with $49,031. This was after having a minus CASH bal. of -$63361! I don't know about you but to inject that much money in AIM would take a lot of guts. DDCA on the other hand did not run out of cash at all and TOT VAL ended at $77,063. Reg AIM had a Portfolio Value low of $4,991! Can you imagine investing all that money to get to that state? DDCA's low was $50,611. Can that be? DDCA's low was higher than reg AIM's ending Value. Now, its true that reg AIM did end up with more shares at the end (5,614 to 2,839). But at what cost? $63,361 extra dollars! I suppose some might say it's not the same since reg AIM started with 2/3 stock 1/3 cash (which I would never recommend by the way) and DDCA started at 50/50, I am sure reg AIM would still have run out of money, as many tests of similar situations have revealed. While I respect AIM and think it's a great concept I have to point out the running-out-of-cash problem is a BIG problem! DDCA will prove to be much better (I hope) as more testing is done. I don't wish to replace AIM, I see this as an improvement. Its still doing the same thing just a little differently. |
||
 |
||
| The little Charts under the Spread sheet shows the Price percentages (left), Held or shares owned (middle) and Cash on the right. Note: I noticed the dates on the spread sheet do not match exactly with Jeff's table. His starts in May of 2000 but skipped Sept. 2001. However the date mismatch is irrelevant for this test. BTW this example shows the old spread sheet. The new one looks almost the same. Disclaimer: I make no claims as to the accuracy or viability of the information contained herein. This web site is presented for reference information only and not intended as advice to buy or sell any securities or funds or any financial sorts of things at all, of any kind. Please! Use caution with any investments you make. It is possible to lose money by following my information and/or using AIM, AIM Rebal, DDCA, SRB, PPO XOver or any other investment plan! |
||