PPO XOver
 |
|||
|
PPO XOver |
|||
For some examples click here.
PPO Crossover is a very simple concept that tells you when to buy and sell stocks and it really works!
A PPO crossover is not new. Many of you are familiar with the MACD ocillator. PPO is almost the same. I believe PPO is better and my way of looking at it is so different that right now it will give superior results. As time goes by, if it becomes popular and many use the system then it will become less effective. Ah, such is life!
Now for a simple sample.
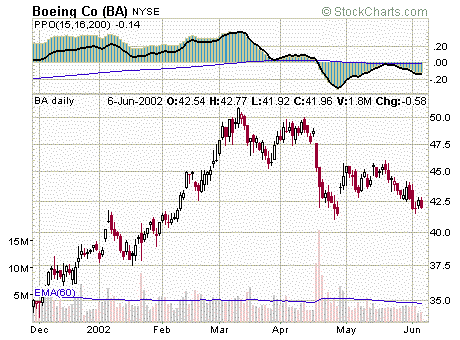
This is the PPO Oscillator as found at stockcharts.com.
stockcharts allows you to change the settings of their indicators. This is good.

As you can see from the above view that at the red vertical line which I drew on this view, the Black line has crossed the (hard to see) horizontal blue line. This denotes a sell signal. If it had crossed on the upside it would have been a buy signal.
Now look at this example of Palm:

Here, the unhappy holder of Palm would be in serious trouble. On the other hand if he would have sold when the PPO crossed the thin blue line then at this point "pure joy" would be his attitude!
now lets look at another example.

Here we are looking at a longer term chart (still daily). the PPO looks a little bit different. But it's really the same.
BA gave 5 signals during the 1 year period. Some were good profit opportunities and some were not. Some "whipsaws" were unavoidable. The system is not perfect.
In late July a Buy signal was indicated by a crossover on the upside. But alas, in early Aug. a sell signal with little profit and indeed probably a small loss.
Of course we all know what happened after that. A downtrend which had started in Aug. had been made much more severe by the events of Sept. 11th and so in the end that sell was a very good thing.
In Nov. a "False signal", a buy signal followed right away by a sell and then again by a buy in early November. Which then resulted in a very good profit. In mid April the rally was over and a sell signal was given. And again, we are glad to be out.
The real beauty of this system is to capture the "Big Moves" and whether your just buying, in which case it also keeps you out of the big down trends, or your playing both sides of the market, buying long and selling short on the down trends, some of the profits will be given up by whipsaws. Most of the big moves will be captured however.
OK, so now you are saying "How do I do this?" It's quite simple:
Go to StockChatrts.com and change a few settings on the Indicator parameters.
On the their Home page, look at the upper right hand corner of the page. In the space provided type in the Symbol of the stock you want and hit the "GO!" Button.
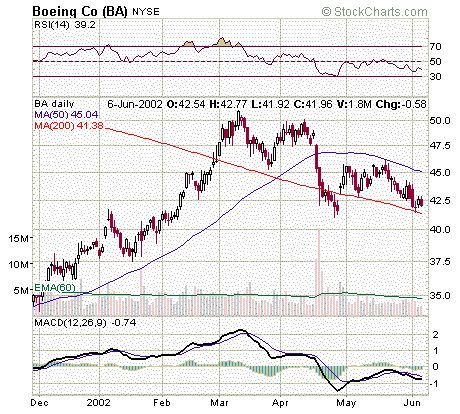
You will get a view like this.

While it's a nice chart, its not what we want. So scroll down to the "Price Plot Attributes:" section below and in the "Indicator Windows:" choose "Price Oscillator (PPO)."
To the right of the Choose boxes are three boxes set to 12, 26 and 9. These are the default settings. You can change these! For PPO Xover....
Set the first to: 15
Set the second to 16.
Set the third to : 200
Let's say you turned off the moving averages and the other indicators you should end up with a chart like this:

What are these odd settings? Well the PPO is really an indicator based on the percentage difference of two moving averages. In this case we use a 15 day and 16 day ma. When the 15 day is above the 16 day, then the heavy black line is above the zero line. When they cross then it goes below and visa versa. We go one step farther though. By setting the third parameter to 200 we are setting the value of a moving average of the indicator itself! This then is the difference. We use a 200 day ma of the indicator itself to determine our buy and sell signals. So when the Black line crosses the 200 day moving average that is our signal. One more point. The vertical bars above and below the zero line of the indicator is are "histograms" of the difference between the blue 200 day ma and the Black indicator line. This is nice because it shows in great detail which side the two are, how much they are apart and whether they have crossed.
Now you might be asking "why not use the good old default MACD or PPO?" The answer is that while they do work fine most of the time they are subject to many whipsaws and vary frequent signals. Too many I think for someone who doesn't want to be glued to the Charts constantly.
Generally speaking, I would avoid the "blue chip" stocks for this method. Even though BA gave some good signals and it would work with them, the yield would not be as good as some of the wilder issues. It seems the blues give more false signals than other stocks. Beware of very low priced stocks too! These do not always give good signals.
I have back tested many stocks using this system and have been very pleased by the results. One thing to beware of is not obeying a signal. If your going to follow the plan then you should react to signals good or bad. In my back testing I was assuming that I would act on the closing price of the signal no matter what the price was. It always worked to a very good profit in the longer run (one year or more).
Someday I will give details of how to do your own fairly accurate backtesting.
For some examples click here.
For a page at stockcharts.com already set to the desired settings....Go here
Disclaimer:
I make no claims as to the accuracy or viability of the information contained herein. This web site is presented for reference information only and not intended as advice to buy or sell any securities or funds or any financial sorts of things at all, of any kind.
Please! Use caution with any investments you make. It is possible to lose money by following my information and/or using AIM, AIM Rebal, PPO XOver or any other investment plan!