
 |
 |
|
As an example lets say you have $10,000 to invest. And lets say you are going to invest in 4 stocks in the $3 to $10 range.
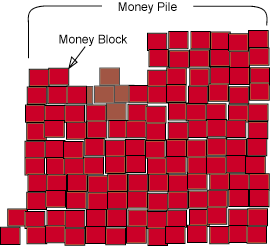
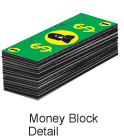
In free shares there is a unit called: Money Blocks. Lets say you divide your $10,000 into approximately 30 parts that would equal $333 each. This would be a Money Block. Or 1/30th of a Money Pile. How did I arrive at 30 parts?.... Later.
 |
|||
 |
|||
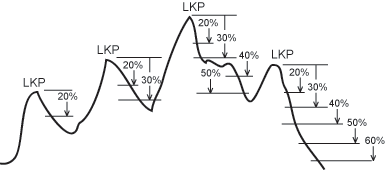
LKP = "Last Known Peak." The next step would be to look at a chart of the stocks your going to buy and determine what the last peak was. It could be a rally on a decline or an absolute peak after a good rise. For now we will just say it was the last peak on the chart on a fairly short term basis.
Next we find out if the price is a minimum of 20% below that LKP. If so it's time to buy some stock.
 |
||
On the 20% decline we would buy $300 of stock.
Now we would buy a progressively larger block of stocks for every decline in increments of 10%.
So: 20%=$300, 30%=$500, 40%=$700, 50%=$900, 60%=$900, 70%=$900, ETC.... Notice that when the decline reached 50, 60 and 70 percent, the investments maximized at $900. This will keep you from getting too much invested in a losing Issue. This is a personal choice, left to the investor. This then is how we buy stocks. If there is a rally on a decline (more than just a blip mind you) then the LKP would be reset to the new peak and the buying sequence would start over: 20, 30, 40% etc. As you can tell by the pretty picture above, the LKP process is quite clear.
Now how do we get free shares you ask?
When you first buy any stock you would take the price times 30% and sell your original investment value at that price and keep the shares left over. So if you bought $300 at $5.00 (20% below LKP of 6.25) and the price rose to $6.5 (30% above the price you paid) you would sell $300 worth of $6.5 stock thus redeeming your original investment minus commissions:
Buy $300 worth at $5.00 = 60 shares held
Sell $300 worth at $6.50 = 46 shares sold
Free shares = 14 shares left
Big deal! Your saying and I agree, but this is what you would get if you bought the stock and the stock turned around and went right up by 30%. You would still have your $300 and your 14 shares ($91) minus costs. Better than nothing. The real beauty of the system is when a longer decline or a trading range brings on more buying opportunities!
Lets say you buy:
20% below LKP of $6.25 = $5.00 : $300 at $5.00 = 60 shares
30% below LKP of $6.25 = $4.37 : $500 at $4.37 = 114 shares
40% below LKP of $6.25 = $3.75 : $700 at $4.37 = 187 shares
Cost Basis: Now it's time to talk about Cost Basis. We have invested $1500 and have 361 shares.
Our cost basis then is: $1500 / 361 shares = $4.16. That is the average price we have paid for our 361 shares.
So now we take our $4.16 average price and multiply that by 30%. So, 4.16 * 1.30 = 5.41. That is our trigger price.
When the price reaches $5.41, we sell $1500 worth of stock (our original investment). Or, 277 shares.
So our 361 shares - 277 = 84 free shares. + Original investment $1500 - costs.
Still not much you say! Not much now, but at the end of a year and many buying opportunities your free shares will add up. And if you are in a trading range with a low priced stock and build a large supply of stock and the price of that issue would rise a goodish bit you would be in a grand position to garner a substantial gain!
That is why the Money Block concept is useful. As I was saying, that of a $10,000 port of four issues, 30 Money blocks would be a rough but good guide. You don't want to stick too much money in any one issue in case there is a big decline. It would be possible to run out of money on a super decline like the one we just went through in 2000-2003. By limiting the purchase to 8 Money blocks ( in this case $2400 for each issue) you have a rule to keep you out of trouble. These are not hard fast rules. Maybe more like guidelines.
In the example above we used 4 money blocks ($1500 / $300 =5). If we had 4 issues going at the same time we might have used perhaps 16 money blocks at the same time. If we would have sold some along the way, for example, the Money Blocks would have gone back to the money pile and would be available again. The way low priced stocks fluctuate, they would offer many opportunities. By the way when I say Low priced stocks I do not necessarily mean penny socks. Though these should not be totally over looked. But rather stock from the $1.00 to $10.00 range. Blue chips would be rather dull and not have sufficient moves in a short period. Blue chips would work but it would have to be a very long term approach indeed.
Note: I have changed the increment from $100 to $200. This is what it should have been from the start. $100 would work and indeed, you can invest what ever amount you want, it's just that this is the model I use and am comfortable with; derived from much testing.
Example XMSR
Example USGA
How I handle Free Shares.
Below is a typical double size Sticky Note. When I buy a stock I fill out one of these. I use Sticky Notes because of the nature of Low priced stocks. It's a transient thing and because I have as many as 24 issues at the same time, Sticky Notes make it much easier to handle .
At the top I write in the Stock Symbol, the LKP (Last Known Peak) and MB (Money Block) in this case it was closer to 2 and that is why I had "II" there. My money blocks are set at $800 so if the total cost is over $800 then I make 2 marks, if over %1600 3 marks, ETC. Its just an easy way to keep track of them.
All the info I need is here: Date, Price, Shares bot, Total quantity of shares, cost of transaction and total cost. Next is the column for CB (Cost Basis) and last is TP (Trigger Price) set at 30% above Cost basis. When I get a sell I often write that info down as shown below but it's optional. After all once a sell has come, I remove the Sticky from my collection of stickys. I do save then for a while in case I want to review.
At the bottom of the Note I write in my Limit Order info so I know where my next buy and sell are. I cross out the old orders when new ones are entered. On the lower right is info denoting the percentage drops from LKP and what those prices are.
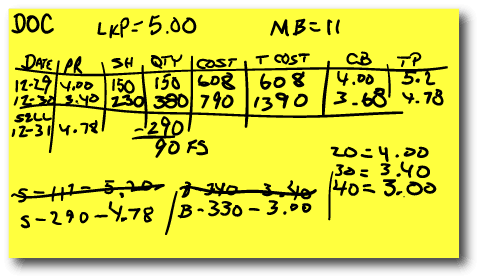
So you can see quite a bit of info is jotted down on the Note. You might ask why I don't do this on a spread sheet? To me this is more convenient because of the large number of issues I handle and I'm not always at the same place when I check my holdings. But I must always carry a cheap Note book (not a computer) with me, kind of like this:

I arrange the Stickys like so, putting them in alphabetical order as much as possible. It really works great. I write the number of the Stock under the Note so I know how many I have running. 1, 2, 3, ........24, 25. I do this so I know how many issues I have at a glance. If the number 19 shows after the last sticky, then I know I have 18 issues at large and its OK to buy more if the opportunity comes up. This may seem trivial but it is not. Otherwise I would have to count how many Stickys I have every time if I own more than a dozen or so. If I were working 12 or less why bother. This is just my way of doing it and it works.
Disclaimer:
I make no claims as to the accuracy or viability of the information contained herein. This web site is presented for reference information only and not intended as advice to buy or sell any securities or funds or any financial sorts of things at all, of any kind.
Please! Use caution with any investments you make. It is possible to lose money by following my information and/or using AIM, AIM Rebal, FREE SHARES, DDCA, DDCA SRB, DDCA PPTM, PPO XOver or any other investment plan!